• About
  • Selected reports
  • Blog
  • Contact
Menu

Tax Sage Network

Street Address
City, State, Zip
Phone Number

Your Custom Text Here

Tax Sage Network

  • About
  • Selected reports
  • Blog
  • Contact

Low overall US corporate taxation

April 21, 2021 Tom Neubig
image001.png

Some commentators have argued that the significant percentage of business income that is not subject to corporate income taxation (roughly one-half) explains why the US corporate tax amounts to 1.0% of US GDP (lowest among all OECD countries). They argue that the U.S. is unique in having such a large non-corporate-taxed sector.

While at the OECD I helped with the OECD’s 2015 report “Taxation of Small and Medium-Sized Enterprises” that surveyed member countries on the share of total business income subject to one level of tax at the owner/investor level or two levels of tax at the corporate and investor level. As expected the U.S. was at the low end of the corporate share due to the growth in sole proprietorships, Subchapter S corporations, and various forms of partnerships. However, Germany and Austria had even lower corporate shares. Other countries had corporate shares less than 75% (Italy, New Zealand, the United Kingdom and Denmark).

The US corporate tax-to-GDP ratio (1.0% in 2018) is significantly less than these other countries with at least 25% shares of non-corporate-tax business income: Germany 2.0%, Austria 2.7%, Italy 1.9%, New Zealand 5.1%, the United Kingdom 2.5%, and Denmark 2.9%.

The U.S. corporate tax-to-GDP ratio is lower than the next lowest OECD countries: 1.1% in Latvia, 1.3% Hungary, 1.5% in Lithuania, 1.9% in Italy, 1.9% in Slovenia and 2.0% in Estonia. The U.S. is winning the race to the bottom with its Baltic small-country competitors. The Joint Committee on Taxation reports that the ratio increased to 1.1% in 2019 and 1.3% in 2020, which would match Lithuania’s ratio.

The current federal statutory tax rate of 21%, favorable rates on foreign source income, numerous corporate tax expenditures, and generous single-tax business rules result in a low level of corporate taxation. Corporate income in the form of dividends and capital gains receive favorable tax treatment at the individual investor level. Many non-corporate businesses benefit from a 20% deduction of qualified business income that was enacted in 2017.

A higher corporate statutory marginal tax rate would increase the incentive for profit-shifting out of the U.S., although such shifting would be limited by tougher US and global minimum taxes and other tax rules. The race to the bottom with respect to corporate tax rates may be over, as the UK government announced plans to increase its corporate tax rate from 19% to 25% in April 2023.

The U.S. should not rely principally on higher corporate and individual tax rates to finance needed infrastructure spending, and should examine tax expenditures and other base-broadeners, including taxing all large businesses as corporations, similar to many other countries.

Tom Neubig

Disparate Racial Impact: Equity-Focused Tax Expenditure Reform Needed

March 16, 2021 Tom Neubig
Disparate+racial+impact+not+equal+sign.jpg

Although U.S. federal tax laws don’t have explicit differences in tax rules by race (disparate treatment), the outcomes of those facially “race-neutral” rules have differential effects across racial groups (disparate impact).

The article published in Tax Notes (3/8/21), and supported by the Swiss economic think tank, Council on Economic Policies, shows significant disparate racial impacts of federal government subsidy and incentive programs run through the tax system (tax expenditures).

A heightened focus on racial injustice should be part of a broader renewed focus on equity considerations in the U.S. tax laws, addressing long-standing and growing racial, income and wealth inequalities.

The article recommends eight steps that should be considered in the reform of tax expenditures for reducing racial and income disparities.

Tom Neubig

Global Minimum Tax: “GILTI co-existence” equals guilty conscience?

October 29, 2020 Tom Neubig
Pic Guilty conscience.png

The OECD’s recent Pillar 2 global minimum tax blueprint anticipates the Pillar 2 global minimum tax would “co-exist” with the US Global Intangible Low Taxed Income (GILTI) minimum tax.  US MNEs would be subject to the GILTI while non-US MNEs would be subject to the Pillar 2 minimum tax. The term “GILTI co-existence” brings to mind the term: “guilty conscience”: a bad feeling caused by knowing or thinking that one has done something bad or wrong.

Although the Pillar 2 blueprint and the US GILTI have similarities, there are important differences that have both potentially bad economic and political implications.  

The US GILTI is a 10.5% (13.125% after 2025) minimum tax on US corporations’ foreign income.  The most important difference between the US GILTI and the OECD Pillar 2 blueprint is the GILTI is calculated on a global-blending basis, while the OECD Pillar 2 blueprint is calculated on a jurisdiction-by-jurisdiction basis.  The US GILTI allows MNEs to earn low-tax-rate income from tax havens combined with higher-tax-rate income from other countries to avoid the GILTI minimum tax.  Non-US MNEs could not benefit from low-taxed income from tax havens.

A global-blending minimum tax is less strict, given the same minimum tax rate and other features, than a jurisdiction-by-jurisdiction minimum tax.  If US MNEs are allowed a less strict minimum tax, it is likely that other countries will want to help their headquartered MNEs with a similarly less strict minimum tax.  The Pillar 2 blueprint is not likely to be politically stable with a combination of two different approaches.  

The OECD economic impact assessment’s revenue estimate of Pillar 2 applies the blueprint approach to all non-US countries, then adds the US Joint Committee on Taxation’s estimated revenue from the US GILTI.  Given OECD’s available data, it would be beneficial if the OECD estimated Pillar 2 applying the blueprint approach to all MNEs, but then showed the loss of revenue from allowing US MNEs to benefit from global blending.  

The OECD data and modeling also would be of interest in showing the difference between a global-blending vs. jurisdiction-by-jurisdiction approach for US MNEs, since Presidential-candidate, Joe Biden, has proposed calculating the GILTI on a jurisdiction-by-jurisdiction basis, in addition to increasing both the US general corporate and GILTI tax rates.

Given the potential for other countries to want their MNEs to have the same global-blending treatment as US MNEs, an additional scenario the OECD should present is the revenue estimate for a universal global-blending scenario.  A similar amount of revenue could be raised with a higher global-blending minimum tax rate.  

Jurisdiction-by-jurisdiction minimum taxes would discourage tax havens from keeping their low tax rates, since MNEs would not benefit from a lower rate on any economic activity or profit shifting to those countries.  With global blending, US MNEs would find some profit shifting to tax havens still attractive to the extent it could be offset by higher taxed income.  Some tax havens would find it attractive to keep their low tax rates to attract US MNE profit shifting. Thus, global blending defeats much of the purpose of the Pillar 2 global minimum tax as a backstop against continued profit shifting, and thus would have lower expected revenue gains and less improvement in investment allocations from reduced profit shifting.  

Although the OECD used aggregated country effective tax rates for their calculation of the Pillar 2 revenue gain, they have public financial statement data for over 27,000 MNE groups.  That data could be used to estimate the revenue effects of the Pillar 2 blueprint with global blending for a list of the top 100 MNEs.  Additional transparency for the proposal’s effect on the largest MNEs would help policymakers understand the types of MNE groups most affected by the proposal.  

Tom Neubig

Economic Impact Assessment of OECD Digitalization Tax Proposals: Foundation for further analyses

October 12, 2020 Tom Neubig
OECDG20 Pic Base Erosion and Profit Shifting.png

On October 12th, the OECD released Blueprints for two proposals (extending taxing jurisdiction and a global minimum tax) to address the increasing digitalization of the global economy and remaining base erosion and profit shifting (BEPS) issues.  In addition, the OECD released its economic impact assessment of the two proposals with sensitivity analyses.  

Kudos are deserved by the OECD team responsible for producing the economic impact assessment.  The report represents extensive and high-quality work.  Although significant data limitations will always confront global tax policy analyses, the use of multiple data sources and their careful configuration makes the analysis less subject to a BAD (best available data) critique.  

Without final details on the two proposals (“pillars”), the analysis presents a range of fiscal and economic estimates which should be helpful to policymakers in their future deliberations on these issues.  The proposals could increase annual global revenues (excluding the U.S.) by $50-80 billion, or roughly 3% of global tax revenues.  The effect on MNEs’ global investments would be modest, overall less than -0.1% of GDP, while the investment effects of a potential trade war due to unilateral digital services taxes could reduce global investment by over -1.0% of GDP.

The results are presented by high, middle and low-income jurisdiction groups, plus investment hubs (jurisdictions whose inward foreign direct investment exceeds 150% of their GDP).  The analysis shows that the revenue gains come at the expense of investment hubs (or tax havens).  While global investment effects would be modest, individual countries, particularly investment hubs, would experience both revenue and investment losses, particularly from the global alternative minimum tax preventing zero or low effective tax rates of the largest MNEs.

Although the OECD staff have the underlying data and analysis for individual jurisdictions, some Inclusive Framework countries did not want the data or analysis for their jurisdictions to be presented.  The OECD staff provided individual countries with toolkits to do their own sensitivity analyses of the fiscal and economic effects and requested input from countries on the potential effects of the proposals on their economies, yet some countries still did not want individual country results or data to be transparent.  

Estimates of the fiscal and economic effects for 200 individual countries would be subject to much greater uncertainty than the jurisdictional groups’ averages.  However, transparency of the underlying data for other analysts to build on, both for analysis of the two digitalization tax proposals but also other global policy proposals affecting MNEs, could be very beneficial for better policymaking.  Countries concerned about the OECD estimates, even with confidence ranges, for their countries should provide their policymakers with their own estimates of the effects of the proposals, and the differing estimates could be critiqued. 

It is unfortunate that some countries in the Inclusive Framework are preventing greater transparency of analytical results and underlying data.  Similar limitations have occurred with even the aggregated results of the Country-by-Country Reporting by the largest MNEs.  

The OECD estimates assume that the US’ Global Intangible Low Taxed Income (GILTI) minimum tax regime, enacted in 2017, would “co-exist” with the global Pillar 2 minimum tax.  This is an important assumption in terms of the fiscal and investment effects, since the GILTI minimum tax rate is calculated on a global basis, while the OECD/G20 Pillar 2 minimum tax rate would be applied on a country-by-country (jurisdiction, rather than global, blending) basis.  Shifting income to low-tax rate jurisdictions would still be desired by US MNEs to offset tax on income subject to higher tax rates, reducing some of the potential anti-BEPS behaviors of US MNEs.  Although the OECD reports empirical evidence that highly profitable MNEs are less tax sensitive than less profitable MNEs with respect to their global investments, their sensitivity to tax rate differentials across countries and into tax havens is significantly stronger.  

Overall, the new economic impact assessment presents important fiscal and economic results to global policymakers and provides a foundation from which additional sensitivity analysis can be performed as the G20 and OECD work toward a global consensus.  Progress on a new international tax system and additional economic assessments for individual countries will hopefully be forthcoming in the first half of 2021.  

Tom Neubig

OECD’s newest Corporate Tax Statistics: Expansion in progress

July 20, 2020 Tom Neubig
Corporate Tax Statistics 2020.png

The newly issued OECD Corporate Tax Statistics publication, and database, presents a number of key dimensions of countries’ corporate income tax systems, including tax revenues, tax rates and tax law provisions for R&D incentives, patent boxes, Controlled Foreign Corporation (CFC) and interest expense limitations as well as hypothetical investment effective tax rates based on depreciation rules.  The publication also includes for the first time aggregated 2016 Country-by-Country Report (CbCR) tabulations for 26 countries, which was discussed in the July 11 2020 blog.  

An important dimension that is missing from the Corporate Tax Statistics is the extent to which the corporate tax base and taxes are eroded by tax expenditures.  The OECD has not published data on countries’ tax expenditures in the past ten years, except other directorates’ publication of fossil fuel and R&D tax expenditures.  

Although certain tax expenditures are controversial in both their identification and quantification, most are obvious, and their quantification is straightforward for Finance Departments.  An easy start for the next Corporate Tax Statisticspublication would be to simply present the total amount of tax credits that reduce corporate tax payments.  Except for foreign tax credits, almost all other corporate tax credits are tax expenditures. 

Many analysts attempt to measure the corporate tax base by dividing corporate tax receipts by the top statutory tax rate.  This understates the corporate tax base for many countries, since tax credits significantly reduce corporate tax payments.  In the case of the U.S., corporate tax credits were $129 billion, or 29 percent of pre-credit tax liability in 2016.  Corporate tax credits (not including foreign tax credits) were also 26 percent of total US corporate tax expenditures in FY2019.  

The 2020 Corporate Tax Statistics includes patent box tax rates for many countries.  It would be useful to know how large the tax expenditures are for patent boxes relative to R&D tax credits.  For example, in the U.S., the foreign-derived intangible income (FDII) tax expenditure, which reduces the corporate tax rate from 21% to 13.125% for certain patent-type income, has a tax expenditure of $7.5 billion compared to the R&D credit tax expenditure of $13.4 billion in FY2019.  The OECD R&D incentive analysis and effective tax rate analysis do not include the effects of patent boxes.  

Similarly, the Corporate Tax Statistics publishes the tax rules for CFC and interest expense limitations, but these do not reflect how important in terms of size of magnitude the provisions are.  Some sense of the magnitude could be helpful to incorporate these provisions in average effective tax rate calculations.  Knowing the specific details of these laws is important, but so is understanding the extent to which the anti-BEPS provision apply and their relative importance.

The OECD’s Corporate Tax Statistics publication has expanded in scope and relevance from its initial publication to the current version.  Hopefully, next year’s publication will continue shedding new light on different dimensions of the corporate and international tax landscape.  Another suggested addition is the 200x200 matrices of bilateral income/sales source/residence headquarter/affiliate tables constructed by the OECD for analysis of the digitalisation tax proposals, cited in the February 2020 Centre for Tax Policy and Administration (CTPA) Tax Talks webcast.   

Tom Neubig

OECD releases 26 countries’ CbCR data: First look for non-US countries

July 11, 2020 Tom Neubig
The OECD just released its second Corporate Tax Statistics publication, which includes County-by-Country Reports (CbCR) data tabulations for the first time. Similar to the first publication, the release can be viewed as half-full or half-empty, espe…

The OECD just released its second Corporate Tax Statistics publication, which includes County-by-Country Reports (CbCR) data tabulations for the first time. Similar to the first publication, the release can be viewed as half-full or half-empty, especially with the scope and limitations of the CbCR tabulations. [Couldn’t resist reusing image from 1/24/19 blog on the OECD’s first Corporate Tax Statistics publication.]

In 2015, I fought hard (and successfully) multiple times to retain eight words in the Base Erosion and Profit Shifting (BEPS) Action 13 report allowing the CbCR to be used “where appropriate for economic and statistical analysis.” Thus, it is gratifying to finally see the initial CbCR reports from 26 countries. The U.S. released its 2016 CbCR data in December 2018, but the OECD Corporate Tax Statistics data is the first time CbCR has been released publicly for at least 24 other countries. Those countries should be applauded for finally releasing publicly their data, although some of their data is in truncated form. Other countries, such as Germany and the United Kingdom, should start reporting their CbC data and help lead in this effort at improved tax transparency.

This new information will help international tax policy analysts understand a broader group of MNEs’ cross-border activities, and also to assist policymakers in the 2020 BEPS Inclusive Framework (IF) review of the current CbCR template. The release will also focus the debate between public disclosure of individual MNEs’ data vs. public aggregated and anonymized tabulations by tax administrations.

The OECD’s CbCR data tabulations are helpful, but also disappointing for several reasons:

· Although intra-group dividends were explicitly excluded from the revenue measure, their treatment was left unclear in the pre-tax profits/income measure defined in the 2015 BEPS Action 13 report. Countries and companies used different approaches resulting in varying degrees of double-counting, which understate tax-to-income and income-to-revenue ratios, as well as distort the geographic allocation of income. Clarification of this issue was made by the OECD in 2019, but it won’t affect the data until 2020 (which will then be confounded by the Covid-19 pandemic). In the meantime, effective tax rate metrics need to be viewed with caution, although many would argue that it may be the Best Available Data (BAD).

· Data for “Stateless entities” were requested to capture companies such as Apple Sales International that had tens of billions of income not reported to any tax authority in 2011-2013. However, stateless entities also include many “tax transparent” entities, such as partnerships which aren’t taxed at the entity level, but rather at the owners’ level. Thus, “stateless entity” data includes both BEPS avoidance along with income on which tax is paid but not at the entity level. The BEPS Inclusive Framework’s 2020 CbCR review is considering alternative meaningful reporting of stateless entities’ data, and that decision should be made quickly so it can apply to 2020 data.

· Details on specific BEPS planning channels is needed. As part of the political process of achieving mandatory CbC reporting, several key financial items were scrapped from the initial draft CbCR template in 2014. The 2020 IF review should include a public debate on the benefits and costs of including related-party royalty payments and related-party interest payments, key features of significant BEPS planning. MNEs are incurring non-significant costs in filing CbCRs, so the data should include important BEPS risk-relevant items in a standardized format for tax administration and tax policy analysis. A few additional key data items would have a high benefit-to-cost relationship.

· Confidentiality is cited by many countries not reporting much, if any, detail on the geographic location of their MNEs’ activities. Finland, Ireland, Korea and Netherlands lumped together all foreign jurisdictions, even though they had 1,216, 1,068, 2,127, and 3,530 foreign subgroups, respectively. Aggregating subgroup information when there are at least 10 or more subgroups in more disaggregated country displays defeats the purpose of country-by-country reporting.

The debate on public individual MNE reporting of CbC data will continue, and the now-apparent limitations of the aggregated and anonymized tabulations will give additional rationale for individual MNE reporting. Nonetheless, the OECD’s Corporate Tax Statistics publication is a significant, albeit incremental, step forward in improved tax transparency about large MNEs’ global tax activities. Issues, such as intra-group dividends, stateless income, and details on BEPS channels, would also be important for analysis of public individual MNE CbC reporting.

The OECD’s compilation of countries’ 2016 CbCR data has already improved tax policy analysis of potential anti-BEPS proposals, such as the Inclusive Framework’s digital tax proposals, by supplementing other existing cross-country data. I look forward to next year’s Corporate Tax Statistics with a second year of CbCR data, with expanded scope and refinements. In the meantime, hopefully academics will find new insights from the large amount of new CbCR data.

Tom Neubig

Best Available Data (BAD) with double-counting and geographic income misallocation

April 23, 2020 Tom Neubig
Tax haven income % FSI.png

Jennifer Blouin and Leslie Robinson, tax accounting professors at Wharton and Dartmouth, respectively, have an important paper on the geographic allocation of multinational enterprises’ (MNEs) reported income. [Link] The paper recently presented at the University of North Carolina’s Tax Symposium [Link] shows that the US Bureau of Economic Analysis (BEA) data, used by many tax researchers, significantly overstates the amount of income reported in tax haven countries.  This affects the magnitude of some estimates of the fiscal effects from base erosion and profit shifting (BEPS). 

Bottom-line: Some estimates of BEPS are overstated due to BAD (Best Available Data, see also 8/31/16 blog), but tax rate differences still significantly encourage profit shifting to minimize taxes.  Better understanding of the data should increase greater transparency of MNEs’ tax and economic activities globally. 

Blouin and Robinson provide critical insights into how MNEs report their financial information. MNEs can report the geographic allocation of their net income in three ways: consolidated, equity method, or cost (dividend) method.  Consolidated reporting eliminates double counting, but then requires some allocation method (e.g. arms’-length transfer pricing, apportionment) for assignment of income to individual countries.  The equity method includes the earnings of lower tier directly-owned (50%+) subsidiaries in the subsidiaries’ countries and also in the country of the direct owner.  Since many multi-tiered corporate structures place holding companies or conduits in tax havens, those countries are assigned the income earned in the tax haven plus the earnings of lower-tier subsidiaries in operating countries.  The cost method includes the dividends received from lower tier subsidiaries in the income earned in the country of the upper tier holding company. 

The BEA Activities of Multinational Enterprises [Link] requires US MNEs to report the earnings of their foreign subsidiaries using the equity method.  Before the Blouin/Robinson analysis, concerns about possible double counting were expressed, but not quantified.  Their analysis, working directly with the underlying BEA data, revels the magnitudes of the double counting and the distorting geographical allocation of the aggregate statistics.  The analysis finds that 41% of US MNEs’ foreign source income in 2016 is from tax havens when the double counting is removed, compared to 62% when not corrected.  The adjusted tax haven percentage is much closer to the 35% I calculated from the 2017 US MNE CbCR report, when all large US MNEs were required to report. [Link]

They also re-estimate the regression analysis of a well-regarded statistical analysis of BEPS.  The analysis also shows that the elasticity of profit shifting to differential tax rates falls from -2.7 to -1.8, which reduces the estimated fiscal effects, but is still quite high. A recent IMF staff meta-analysis of profit shifting [Link] found a mean elasticity of -1.0, which is also high.  An elasticity of -1.0 means a 10-percentage point difference in tax rates results in a 10% shifting of profits from higher-rate to lower-rate countries.  A -1.8 elasticity means that a 10-percentage point difference results in an 18% shifting of profits.  Even with a 21% US federal corporate tax rate and a zero-rate tax haven, the tax rate differential could result in a 21-38% shifting of profits, absent other tax base protection measures such as Controlled Foreign Corporation, interest limitations, or minimum tax rules.

The Blouin/Robinson paper finds that studies of BEA data by Zucman et. al as well as US tax return data suffer from double counting and geographical misallocation.  The G20/OECD BEPS Country-by-Country Reporting (CbCR) data does not have the geographical misallocation but includes some double-counting in the “Stateless Income” reported.  Some stateless income is from fiscally transparent entities, such as partnerships, as well as from some of their owners that meet the reporting requirement of $850 million of annual revenue.  The OECD BEPS Action 13 public consultation [Link] on possible revisions to the CbCR notes several approaches to greater transparency of “Stateless Income,” which could show the potential double-counting and geographic misallocation, as well as highlight entities that don’t report taxable income to any jurisdiction.  The Blouin/Robinson analysis show that 2020 revisions to the CbCR are needed.

More detailed reporting of multi-tiered MNE income is needed to improve tax administrators’ ability to perform high-level risk assessment and for policy analysts to more effectively use financial data (accounting, tax, and CbCR) to analyze BEPS and the effects of BEPS policy changes.  Many MNEs have enormously complex corporate structures for tax minimization, regulatory and business reasons.  Greater transparency in financial accounting and/or CbCR would highlight MNEs structuring tax conduits through tax havens. 

Blouin and Robinson have made a significant contribution to the financial accounting, tax and BEPS research with their focus on the details of the underlying BEA data, used by many analysts.  The BEA data has been the Best Available Data (BAD), but now we have a better idea of how BAD it was, and also how it can be improved for future analysis.  Their analysis should make us question the magnitudes of many BEPS analyses, but it still shows that BEPS was still a significant problem in 2016 and still requires continued focus and tax policy changes to reduce remaining BEPS. 

Twenty plus countries’ CbCR data is being used in the OECD’s economic impact assessment of the digitalization tax proposals and is scheduled to be included in the OECD’s second Corporate Tax Statistics publication later this year.  That information will help assess the extent to which BEPS was principally a US MNE phenomenon or more widespread.  Additional analysis of the BEA and CbCR data could also assess how pervasive BEPS is by size of MNE, and whether the CbCR reporting threshold of $850 million of annual global revenue should be lowered. 

Tom Neubig

OECD webcast on economic assessment of digitalisation tax proposals: 13 February

February 5, 2020 Tom Neubig
shutterstock_1456634993-200x200.png

As part of the work by the OECD/G20 Inclusive Framework (IF) on BEPS relating to the tax challenges arising from the digitalisation of the economy, the OECD has been carrying out an economic analysis and impact assessment of the Pillar 1 and Pillar 2 proposals. A live webcast with experts from the OECD's Centre for Tax Policy and Administration and Economics Department will include a presentation of preliminary results on the revenue and investment effects of the proposals.

Register for the webcast at 9am eastern on Thursday, February 13th, at http://www.oecd.org/tax/beps/webcast-economic-analysis-impact-assessment-february-2020.htm

David Bradbury and his team will help you understand the data and methodologies for the economic analyses and impact assessments of Pillar 1 and Pillar 2 proposals, as well as the data and models’ capabilities and limitations.  

Although there are significant limitations on the available data for such complex proposals and to evaluate those effects for 100+ countries, use of multiple data sources, both micro and macro data, fill in many of the gaps that would occur if using only one database.  

The specific proposed tax rules have not been decided by the BEPS IF, but good modelers can build economic and fiscal models with capabilities of changing policy parameters to evaluate alternative proposals and also to do sensitivity analysis of key parameters.  They will be ready to evaluate the economic and fiscal effects of a final proposed package when the IF makes its decisions.  

I think you will be impressed with the preliminary analysis, albeit subject to available data limitations, but which will continue to be improved with additional input from individual countries’ finance ministries and outside groups, and and will be ready to evaluate the Inclusive Framework’s specific proposals later this year.

Tom Neubig

Some Initial Observations from the 2017 US Country-by-Country Report Tabulations

December 19, 2019 Tom Neubig
CbCR 2017 blog graph better #2.png

The IRS Statistics of Income released the 2017 Country-by-Country reports (CbCR), a major transparency initiative of the OECD/G20 Base Erosion and Profit Shifting (BEPS) project.  The 2017 data is the first year of mandatory reporting by US MNEs. 

The 2017 CbCR reports provides important aggregate tabulations of US-headquartered MNEs operations globally, for those with over $850 million of total revenues.  The CbCRs are designed to assist tax administrations more effectively audit MNEs to identify BEPS behaviors.  The aggregate tabulations will help policy analysts analyze global tax reforms, such as Pillar 2 global minimum tax proposal being considered by the OECD/G20 Inclusive Framework on BEPS in their work addressing the tax challenges of the digitalisation of the economy.  

2017 aggregate tabulations.  1,575 US MNE groups filed 2017 CbCRs with the IRS, most reported activity in the United States.  In 2016, 1,101 MNE groups voluntarily filed CbCRs.  Comparisons between 2016 and 2017 are therefore difficult due to different years as well as a different group of MNEs.  

The large US MNEs reported $2.0 trillion of profits on $21.6 trillion of total revenues, $323 billion of income tax paid and $376 billion of income tax accrued.  The average profit rate on revenue was 9.4% with an effective tax rate of 16.0%.  Roughly two-thirds of the revenue, profit, and income tax paid was in the United States.  US subgroup activity had slightly lower profitability rates (8.5% compared to 9.3% for foreign) and slightly higher effective tax rates (ETR) on tax paid (18.1% compared to 17.0% for foreign). “Stateless entities” had an average 25% profit rate and a corporate ETR of 0.6%.  

CbCR 2017 blog agg tabs.png

In 2017, 620 “stateless entities” filed CbCRs.  Many of these are “fiscally transparent” enterprises, such as partnerships and Limited Liability Corporations (LLCs), which are taxed at the owner level, rather than at the corporate or entity level.  They reported $204 billion of profits, or about 10% of total profits reported by large US MNEs.   Some “stateless entities” may be corporations, such as reverse hybrids, that would pay corporate income tax, except for tax planning.  Separating these two types of “stateless entities” would assist in better understanding  the data.

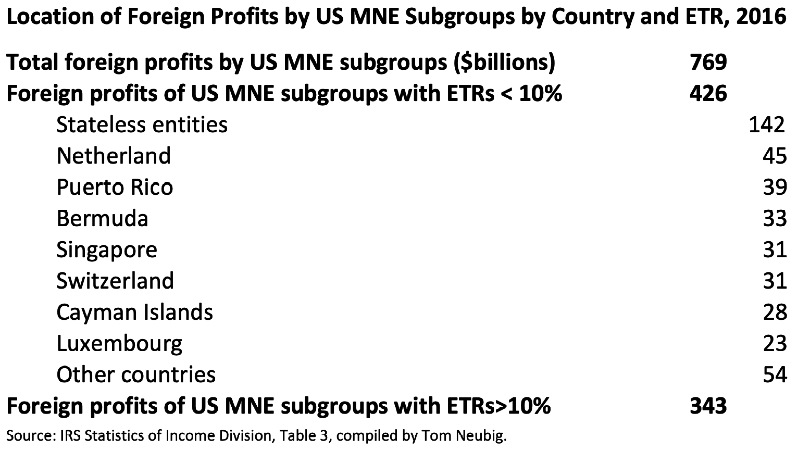
Effective tax rates.  The IRS published the distribution of effective tax rates (income tax accrued divided by profits) of MNE subgroups.  Subgroups are “constituent entities” (affiliates) that have tax jurisdiction in the same country.  The 1,575 reporting MNE groups have 35,008 subgroups, of which 11,055 have negative or zero reported profits.  Roughly 24,000 subgroups reported $2.4 trillion of positive profits.  Subgroups with ETRs of less than 5% (including negative tax with positive profit) accounted for 47.5% of total positive profits.  Subgroups with ETRs less than 10% accounted for $1.36 trillion or 56.5% of total positive profits.  Some of these low ETR subgroups could be partnerships or other entities taxed at the owner level, but since stateless entities only accounted for $215 billion of positive profits, almost half of total positive profits were subject to tax rates below 10% for US MNE corporations.  

CbCR 2017 blog ETR.png

If a minimum tax of 10% had been imposed at the subgroup level (“country-blending”) on these large US MNEs, it would have raised $107 billion in 2017 on a static basis.  Some of the low-ETR subgroups will be subject to the 2017 tax legislation GILTI-provision, although that is done at an overall consolidated group level basis.  The reported ETRs may be understated due to inconsistency in how intercorporate dividends are reported due to lack of guidance on whether they should be excluded from profits.  Going forward, intra-corporate dividends will be excluded from reported profits.  

The IRS release of the 2017 CbCR includes a lot more information about US MNE’s operations, profits and taxes across countries and across industries.  More analysis of the new data is needed.  

Some next steps.  The OECD will be publishing a number of other countries’ CbCR aggregate tabulations, similar to the US tabulations, in a forthcoming OECD Corporate Tax Statistics report.  The CbCR tabulations will be helpful in the analysis of the Pillar 2 global minimum tax proposal.  Aggregate tabulations of the CbCR data will be new data for many other countries, which don’t have the US equivalent of the Form 5471 tabulations and the BEA’s Activities of Multinational Enterprises tabulations for US MNEs.  

CbCR data provide the IRS and other tax administrations with additional information beyond the data reported on the Form 8975.  A report by the IRS on how CbCRs are helping improve their audits of MNEs would be useful.  The SOI is also using academic tax researchers to help analyse the data on a micro basis, although all tabulations will be aggregated and anonymized, but such analysis will likely provide additional insights on key relationships.  

Additional information about foreign-headquartered MNEs operating in the U.S., beyond the Form 5472 data, will become available with the reporting of other countries’ CbCR tabulations.  Analysis of that data, while incomplete, will supplement the tabulations from US MNEs. 

Finally, the BEPS Action 13 report calls for a reevaluation of the CbC reporting in 2020.  Input from tax administrations’ use of the individual CbCRs as well as tax policy analysts’ use of the aggregate tabulations should inform changes to the CbCR data template as well as the extent to which more publicly available data from the CbCR would be desirable.  

Tom Neubig

Should Digital Services (Gross Receipts) Taxes be a Harmful (Income) Tax Practice?

December 7, 2019 Tom Neubig
BEPS Action 5 report.png

As the OECD/G20 Inclusive Framework (IF) on Base Erosion and Profit Shifting (BEPS) pursues reform of the international tax system, should a third pillar of the reform be classifying Digital Services Taxes (DST), structured as gross receipts taxes in lieu of net income taxes (DS(GR)T), as a harmful tax practice.  Such an approach would prevent such DSTs from being imposed by IF members, subject to peer review, thus preventing potential double taxation and increased complexity and compliance costs.

Action 5 of the BEPS Action Plan committed the Forum on Harmful Tax Practice to improve transparency and require substantial activity for any preferential regime.  It required compulsory spontaneous exchanges of information between tax administrations for six categories of potentially preferential tax rulings, plus elaborated substantial activity factors to preferential regimes, including IP or “patent box” regimes.  As a mandatory action, countries in the Inclusive Framework have repealed or modified non-compliant IP regimes to comply with the prohibition against harmful tax practices. 

The OECD Secretariat’s Unified Approach Pillar 1 to expanded economic nexus and greater allocation of taxable net income to market jurisdictions should address many of the concerns of countries with DS(GR)Ts (e.g. France, Italy, Austria, UK, and others) about significant remote sellers not paying corporate income tax on their local economic activity.  This alleviates the need for a gross receipts tax to substitute for net income taxation. 

Some tax law academics have argued that a DS(GR)T might be justified as a way of taxing corporate rent (“excess profits”), since the marginal cost of expanding digitally and remotely into an additional country is close to zero.  Thus, certain incremental gross receipts are close to incremental net income, and those profits are over and above the required return for investment, and thus close to “economic rent” or “excess profits”.  While this might be true for incremental expansion into one country, gross receipts greatly overstate net income for the enterprise. 

Improving the international tax rules with economic nexus and allocation of consolidated net income among all countries with economic nexus makes much more sense than a DS(GR)T.  A complementary pillar to Pillar 1 could be to treat DS(GR)Ts as a harmful tax practice that should be prohibited for IF members.

A digital services tax, however, could be an appropriate complement to countries’ value-added taxes (VAT), where “free” digital services are currently not subject to VAT, thereby placing “free” digital services at a competitive advantage to priced digital services and non-digital goods and services.  In a two-sided business model, digital services companies receive advertising revenue to offset the cost of providing free digital services for users’ data and attention.  Although a Nov. 2018 blog discussed how these barter transactions might be imputed to digital service users, an alternative approach would be for the digital services company to collect VAT on the advertising revenue as a proxy for the value of the “free” digital services provided to local customers.  The DST should apply to the advertising revenue used to finance the provision of “free” services.  Arguably, this could apply to non-digital services where subscription fees do not cover the cost of the provision of the services, so could include TV and newspapers.  Instead of low tax rates designed to mimic effective income tax rates when applied to gross receipts, such as 3% in France, the DST should be subject to full VAT rates (e.g. 20% in France).

Tom Neubig

New US CFC tax data from 2016: No evidence of declining tax haven use

October 31, 2019 Tom Neubig
US CFCs in Tax Havens.png

The IRS Statistics of Income Division just released its biannual US Controlled Foreign Corporation (CFC) data for 2016.  US multinational corporations are required to file Form 5471 for each CFC noting the country of incorporation, assets, receipts, earnings and income taxes paid.  Sixteen thousand US corporations had 95,000 CFCs with earnings of $1.07 trillion in 2016.  

The change in US CFC tax return data between 2014 and 2016 provides some empirical evidence of whether the G20/OECD Base Erosion and Profit Shifting (BEPS) project changed some US MNEs’ tax-planning behaviors.  The final BEPS reports were published in October 2015, and four minimum standards including Country-by-Country Reporting (CbCR) rules for large MNEs would have been fully anticipated in the 2016 filings.   Some contemporaneous tax director surveys reported that US MNEs were changing some of their international tax planning and operations, such as increased focus on reputation risk and curtailing so-called “cash boxes,” as cited by the OECD report to the G20 Leaders in July 2017.

Although the BEPS four minimum standards and the revised transfer pricing guidelines were not expected to significantly affect US MNEs, given extensive US transfer pricing regulations and Form 5471 reporting, changes in US MNE tax activity might become apparent comparing Form 5471 reporting in 2014 with the reporting in 2016.  Some MNEs might have “cleaned up” their global operations shedding some tax haven subsidiaries in anticipation of CbCR reporting.  Some MNEs might have shifted income away from “cash boxes” to other countries with low tax rates but with real economic activities.  

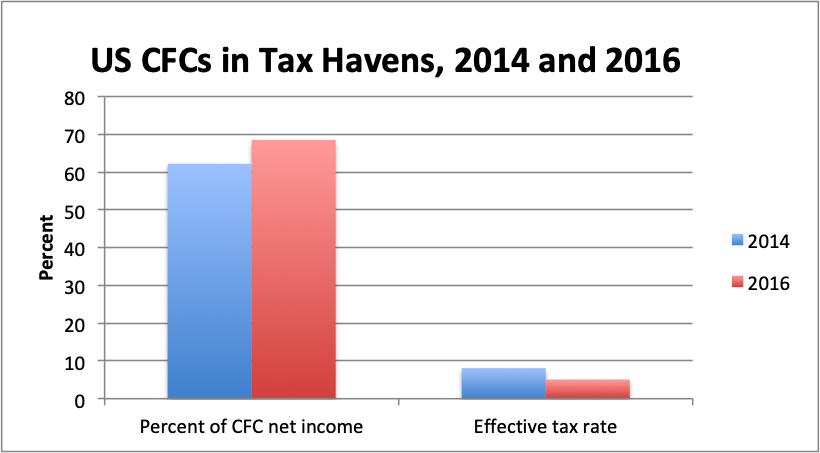
The 2016 US CFC tax return data do not appear to show a significant reduction in BEPS in terms of measures of income earned in countries that have been labeled “tax havens” and the effective tax rates on that income.  Between 2014 and 2016, the share of CFC income actually increased from 62% to 68% in nine “tax haven” countries (Bahamas, Bermuda, British Virgin Islands, Cayman Islands, Ireland, Luxembourg, Netherlands, Singapore and Switzerland).  $733 billion of the total $1,070 billion earned by US MNEs’ CFCs were earned in those countries.  The effective tax rates on the income earned in those countries declined from 8.1% in 2014 to 5.1% in 2016.  Some compositional change in tax haven locations may be occurring, as shown in the table below, but may be due to non-tax factors.

9 Tax havens CFC data.png

Implementation of BEPS was still occurring in 2016 in many countries, along with the European Union’s Directive on Anti-Tax Avoidance.  National legislation was required for implementation of many of the anti-BEPS provisions with future effective dates.  Thus, 2016 may be too early for significant anti-BEPS changes in US MNEs’ behavioral effects.  Major changes in US international and corporate tax rules in December 2017 are expected to reduce profit shifting from the U.S., including the reduction in the US corporate tax rate from 35% to 21% and the introduction of the GILTI (minimum tax rate on foreign income) provision.  

Release of US CbCR 2017 data, the first year of mandatory reporting, is expected in December 2019.  The OECD Corporate Tax Statistics publication of many other countries’ aggregated CbCR tabulations is expected early in 2020.  This additional data will provide a baseline from which to measure anti-BEPS effects going forward.  A two-year wait for 2018 US CFC data reflecting full implementation of the BEPS project and the significant US tax changes will seem like an eternity.  

Tom Neubig

Cross-border tax rate differentials drive BEPS: A global minimum tax would reduce those differentials

October 10, 2019 Tom Neubig
Rate diff min tax 2.png

Profit shifting by multinational enterprises across jurisdictions is driven by tax rate differentials.  The U.S. reduced profit shifting from the U.S. by reducing its 35% federal corporate income tax (CIT) rate to 21%, and other 2017 tax changes.  However, while the global average CIT rate has been declining, tax rate differentials across countries have been increasing (see blog April 3, 2017).

One important effect of proposals to address the tax challenges from digitalisation of the global economy currently being considered by the Organization for Economic Cooperation and Development (OECD) is the potential reduction in cross-border tax rate differentials.  Both the potential Pillar 1 nexus and reallocation rules and the Pillar 2 global minimum tax proposals reduce tax rate differentials, and thus would reduce profit shifting.  The extent to which they reduce BEPS and the associated revenue losses from BEPS will depend on their design.  This note examines the extent to which tax rate differentials are reduced by a 10% global minimum tax.  

Based on reporting by 94 jurisdictions in the OECD Corporate Tax Statistics Database (35 OECD countries and 49 non-OECD countries ranging from small tax havens to China and India), tax rate differentials can be calculated with 2018 tax rates and with a global minimum tax.  

Bottom-line: a global minimum tax on a jurisdiction-basis would reduce general CIT rate differentials by 9% and would reduce preferential CIT rate differentials by 20%.  Since intangible income is more likely to be subject to profit shifting and subject to preferential rates, the overall effect of a global minimum tax at 10% could be as much as 15% (roughly the average of the general and preferential rate differences).  

In addition, recent research by JCT economists (Dowd, Landefeld and Moore, 2017) finds that profit shifting is greater when tax rate differentials are large. A global minimum tax reduces the average tax rate differentials with zero rate havens from 23.5% to 13.9%, a 41% reduction.  Thus, the reduction in profit shifting from a global minimum tax is likely to have a greater positive effect than a uniform reduction in tax rate differentials.  

Background on the calculations

The 2018 corporate tax rates come from the OECD’s Corporate Tax Statistics Database; the GDP and inbound foreign direct investment (FDI) statistics from the IMF’s World Development Indicators; and the summary of preferential tax regimes from the OECD’s Centre for Tax Policy and Administration.  The table below shows the descriptive statistics:

OECD CIT rates 2018.png

Simple average CIT rates suggest non-OECD countries have lower average rates than OECD countries, but that is because tax havens, such as the Cayman Islands, are given the same weight as China and India.  When using GDP-weighted averages, the non-OECD countries have similar average rates as OECD countries, but the variation in general tax rates across countries as shown by the standard deviation is significantly higher for non-OECD countries.  

Average tax rate differentials across the 94 countries are calculated using a 94x94 matrix, calculating the tax rate differential for each country with the other 93 countries.  Tax rate differentials are weighted by the amount of inbound FDI in each country.  Tax rate differentials are calculated where the home country’s tax rate is higher than the tax rates of countries receiving inbound FDI.   

As shown in the graph above, the average general tax rate differential for the 94 countries is 6.1% in 2018, but would decline to 5.4% with a 10% minimum tax on a per country basis.  The average preferential tax rate differential is 6.0% in 2018, but would decline to 4.8% with a 10% minimum tax.  Assuming profit shifting is half from general rate differentials and half from preferential rate differentials, the overall decline in profit shifting would be roughly 15% with a global 10% minimum tax.  

This reduction would increase tax bases of low, middle and high-income countries that have rates above 10%.  Countries with general CIT rates below 10% account for less than 2% of global GDP and 7% of inbound FDI.  Countries with preferential tax rates below 10% account for 4.5% of global GDP and almost 20% of inbound FDI.

Pillar 2 proposals would have a static revenue gain from a global minimum tax, but also a revenue gain from reduced profit shifting due to smaller tax rate differentials.  Similarly, Pillar 1 proposals for revised profit allocation rules would reduce tax rate differentials between tax havens and other countries, resulting in less profit shifting and increased tax revenues, beyond the reallocation of taxable income.  

Smaller cross-border tax rate differentials also reduce tax-induced economic distortions across a number of different economic margins.  Future analyses of the economic and revenue effects from specific proposals arising out of the OECD tax digitalisation initiative will be helpful to policymakers in designing a new consensus-based international tax system for the 21st century.  

Tom Neubig

Country-by-Country Reporting Transparency Initiatives Are Working: Initial Evidence

July 26, 2019 Tom Neubig
Picture from Rasmus Crolin Christensen of Copenhagen Business School.

Picture from Rasmus Crolin Christensen of Copenhagen Business School.

During the OECD/G20 Base Erosion and Profit Shifting (BEPS) Project, many participants believed the increased transparency from country-by-country reporting (CbCR) by the largest MNEs to tax authorities would have the largest effect of all of the BEPS Actions.  Some initial studies with data since implementation of CbCR initiatives report positive effects of increased tax transparency on reducing profit shifting. I look forward to additional studies examining different types of transparency initiatives.

Michael Overesh and Hubertus Wolff of the University of Cologne recently examined the effects of the EU’s financial regulatory CbCR reporting by EU multinational banks.  <Link> Unlike the BEPS CbCR, the EU financial reporting was in public financial statements.  The analysis compared the tax expense of multinational banks before and after the CbCR and to other banks and corporations unaffected by the requirement.  They found the largest effect among multinational banks with activities in tax havens.  Those banks increased their effective tax rates by 3.7 percentage points relative to other banks after the CbCR disclosure.

The study didn’t analyze the specific reasons for the increase in the effective tax rate, but did show that profitability in some tax havens was substantially reduced.  The study did not distinguish between the effect of better informed tax administrations versus the effect from public disclosure of increased reputational costs of corporate tax planning.  

Lisa De Simone and Marcel Olbert report strong empirical evidence that multinational corporations above the €750 million global revenue threshold closed down tax haven subsidiaries as a result of the BEPS Action 13 CbCR requirement.  <Link> Not surprisingly, they found shifting of some real economic activity to European low tax “non-haven” countries, such as Ireland and Luxembourg.   Other studies label Ireland and Luxembourg “tax havens”, so some of the shifting was toward “tax havens” with at least some economic substance.  

Preetika Joshi, Ed Outslay, and Anh Persson also analysed the EU financial reporting tax disclosure on bank MNEs and found substantial reductions in profit shifting by their financial affiliates. <Link> They also found increased income shifting by the banks’ industrial affiliates, not subject to the disclosure, thus mitigating the overall effect on the banking MNEs’ tax liability.  The BEPS CbCR does not have this glaring loophole of the EU financial reporting disclosure.  

Overesh and Wolff note that financial transparency is “an additional instrument for policy makers to curb corporate tax avoidance.” In fact, recent OECD research found that disclosure and exchanges of information on off-shore financial holdings by high-wealth individuals between tax administrations reduced by roughly one-third the amount of bank deposits held in international financial centers. <Link>  The Global Forum on Transparency and Exchange of Information for Tax Purposes has implemented Automatic Exchange of Information between more than 90 jurisdictions using the OECD’s Common Reporting Standard to exchange information on 47 million off-shore accounts, totaling €4.9 trillion. <Link>

In addition to the BEPS Action 13 CbCR requirement, the BEPS Project included another mandatory transparency measure, Action 5, requiring countries to report tax rulings to other countries that relate to preferential regimes, cross border unilateral transfer pricing rulings, and others that might give rise to BEPS concerns.  This has resulted in a number of preferential tax regimes being closed or modified, and provided tax administrations with an additional perspective on MNEs’ tax positions in other countries.  Although not a mandatory requirement, BEPS Action 12 provided a framework for countries to obtain early information on potentially aggressive or abusive transactions, arrangements, or structures.  Since then, a number of additional countries have adopted mandatory disclosure rules on promoters and/or taxpayers of potential questionable tax practices. 

Greater tax and financial transparency for multinational corporations and high-wealth individuals combined with multilateral tax cooperation is making a difference in reducing global tax avoidance and tax evasion.  Tax administrations need additional tools and resources to ensure effective enforcement of the tax laws with the additional information.  Efforts to enhance the use of the CbCR data are underway by the Platform for Collaboration on Tax and the Federation of Tax Administrators, including a handbook on Effective Tax Risk Assessment of CbCRs.  <Link>  Taxpayer responsiveness to tax rate differentials across countries will be reduced by these transparency and exchange of information initiatives.  

Tom Neubig

First Look at US Country-by-Country Reporting Tabulations

March 28, 2019 Tom Neubig
CbC blog pic1.png

IRS released aggregated Country-by-Country Reporting (CbCR) data from large US-headquartered multinational enterprises (MNEs) from 2016, the initial year of the OECD/G20 BEPS transparency implementation.  [Link] The six tables provide a first look at CbCR data from US MNEs, which show some of the insights as well as limitations of the reported data. 

1,101 US corporations and partnerships filed Form 8975 for 2016.  Additional US MNEs are expected to file in 2017, the first year of mandatory reporting. The reporting MNEs had global revenue in excess of $850 million.  The US ultimate parents had 26,473 constituent entity subgroups in separate jurisdictions.  The total number of constituent entities was 154,000, with roughly 54,000 entities in the US and 100,000 entities outside the US.  Given the aggregation in the CbCR template, multiple entities in a single country are combined into subgroups for reporting purposes.  Form 8975 data filed by 14 foreign controlled domestic corporations are not included in the tables. 

As the OECD/G20 BEPS Action 13 states: “The Country-by-Country Reports will be helpful for high-level transfer pricing risk assessment purposes.”  It goes on to say: “It may also be used by tax administrations in evaluating other BEPS related risks and where appropriate for economic and statistical analysis.”  The IRS should be commended for releasing these aggregated tabulations, prior to the inclusion in a forthcoming OECD Corporate Statistics publication with other countries’ CbCR data.  With the consideration of revised profit allocation and nexus rules and a global anti-base erosion proposal [Link], the CbCR data will provide significant incremental insights into MNEs’ business and tax activities. 

Effective Tax Rates. The table below shows 950 US MNE groups had 4,246 subgroups in jurisdictions with positive profits yet effective tax rates less than 5%.  These subgroups accounted for 18% of revenue, 48% of net profits, and only 3% of income tax accrued.  $689 billion of profit was earned by profitable MNE subgroups with ETRs less than 5%.  Their profits were 24% of their total revenue and 52% of their tangible assets.

CbCR blog pic#2.png

322 (or 29%) of the MNEs groups reported profitable “stateless entities” which earned $142 billion of income (18% of total non-US net profit) and paid only $700 million in foreign income tax (an effective tax rate of 0.6%).  The OECD instructions required a separate line for all constituent entities in a MNE group deemed by the reporting MNE as not resident in any tax jurisdiction for tax purposes.  These include “fiscally transparent” entities or “ghost companies,” such as Apple Sales International that earned tens of billions of income not reported to any tax authority several years ago since it was incorporated in Ireland but managed and controlled from the U.S.  The CbCR data reports over 10,000 stateless entities controlled by US MNEs.  Some of the stateless entities are pass-through partnerships that are not subject to corporate tax but are owners are subject to personal income tax, while others are “reverse hybrids” with significant untaxed income.  

Domestic vs. Foreign Activity. The CbCR data includes parents and domestic affiliates in the US as well as US MNEs’ subsidiaries and branches in other countries.  The table below shows the largest US MNE’s for their profitable entities reported 65% of their revenue as received in the US and 56% of their total profits earned by US entities.  [84 of the 1,101 US MNEs did not report activity in the US, which is likely a data issue in the first, voluntary year of implementation, but which would overstate non-US activity since calculated as All Jurisdictions less U.S..] The profitability of the US entities was lower than their non-US entities.  The ratio of profit to total revenues was 10.5 for US entities versus 15.5% for their non-US entities.  The ratio of profit to tangible assets was 27.8% for US entities versus 52.8% for non-US entities.  One cause of that difference is likely the shifting of intangible assets out of the US to jurisdictions with lower tax rates.  In addition, the ETR for US entities was twice that of the non-US entities (18.9% and 9.6%, respectively).

CbCR blog pic#3.png

CbCR vs. Other MNE Data. US government data on US multinationals has been extensive and best in class, so the CbCR reports will be most helpful in other countries.  The US publishes tax return data from the Form 5471 from Controlled Foreign Corporations.  [Link]  The US Bureau of Economic Analysis publishes data on the Activities of Multinationals Enterprises (AMNE).  [Link]  The table below shows selected comparisons of the Form 5471 data (from 2014) and the Form 8975 data (from 2016).  Since only MNEs with global revenues exceeding $850 million file the Form 8975, the total amounts reported on the Form 8975 are lower.  The relative effective tax rates for the Caribbean island havens and Ireland are flip-flop, likely due to different years, different MNEs included, or different reporting measures.  

CbCR blog pic#4.png

Academics have noted the concentration of foreign income of US MNEs from Caribbean islands, Ireland, Luxembourg and Switzerland, accounting for 63% of total foreign income from the BEA AMNE (2016) and 59% of total foreign income from the Form 5471 (2014). The CbCR data show only 24% of total foreign income from those countries as reported by the largest US MNEs in 2016. Reasons for the difference are worth pursuing as well as reasons for the negative net income reported from US MNE affiliates in Luxembourg and Switzerland.  

Opportunities.  The new CbCR data provides some important insights into the business and tax activities of the largest MNEs.  Tax administrations will be able to use it for high-level transfer pricing enforcement, more efficiently identifying issues for further examination. Statistical and economic analysis of the aggregated data will help policymakers and policy analysts understand additional dimensions to MNE activity, such as stateless entities and low ETR entities. For example, estimates of so-called residual profits in excess of a return on tangible assets (similar to the new U.S. Global Intangible Low Taxed Income provision) can be calculated. 

As more analysts examine the new US CbCR data tabulations additional insights as well as questions for further data collection and analyses will emerge.  As CbCR data for other countries are tabulated and published by individual countries or the OECD, it will be important to determine if stateless entities and low ETR entities are as prevalent in non-US MNEs. They will also provide additional information to supplement the IRS Form 5472 data on foreign-owned US corporations.

Limitations.  Aggregated tabulations limit the number of dimensions that can be explored analytically. Due to confidentiality issues, other countries will not be able to provide the same granular detail as the U.S. with its 1,101 ultimate parents reporting.   The US CbCR data fortunately included tabulations for profitable entities, rather than limiting tabulations to net income (profit less losses), which is not a good a measure of taxable income.  

The new data is for a snapshot in time.  It will be important to use the CbCR data to analyze changes over time as the BEPS minimum standards and national anti-base erosion rules take effect.  For example, what would the data have shown in 2013 before the BEPS Project and the anticipation of such transparency?

Aggregated results can prevent accurate measurement of distributions, such as low ETRs.  For example, the ETR tabulation reports that $689 billion of income was subject to an ETR of less than 5%.  By contrast, tallying the country distribution of profitable entities with an average ETR of less than 5% results in only $318 billion since entities with low ETRs are located in countries with higher average ETRs.

The data does not help analysts understand why ETRs are low or high.  Low ETRs could be due to low statutory tax rates, special deductions or exemptions, tax credits, or aggressive tax planning.  Additional analysis with other data is needed.

In addition to uncertainty about the composition of “stateless entities” between pass-through entities vs. zero-taxed hybrid entities, the CbCR data may include some double counting of inter corporate dividends. Income from lower-tier subsidiaries distributed as dividends to higher-tier entities may also be included by the higher-tier entities.

The revenue data is helpfully broken out between third-party and related-party revenue, but the revenue is origin-based, not destination-based. The revenue is from the location of the entity selling the product or service, not where the final consumers are located.

Progress.  Kudos to the IRS Statistics of Income Division for its timely release of the initial US Country-by-Country Report tabulations with tabulations helpful to both tax administration and tax policymaking.  The OECD/G20 BEPS Action 13 Transfer Pricing Documentation and Country-by-Country Reporting is now a minimum standard of the 129-member BEPS Inclusive Framework.  The increased transparency of MNEs’ business and tax activities is a significant step forward in reducing tax-induced profit shifting.  I look forward to the release of other countries’ CbC reports and future years’ reports to track changes in BEPS over time. 

Tom Neubig

Half-full/half-empty, but more to come: OECD’s first Corporate Tax Statistics publication

January 24, 2019 Tom Neubig
Half empty.png

The OECD’s first Corporate Tax Statistics publication is a useful compilation of prior OECD corporate tax statistics, plus extension of some statistics to close to 100 countries participating in the BEPS Inclusive Framework.  It is a first step in what hopefully will be a more in-depth database and analyses of domestic and cross-border business taxation.  

The report includes statistics on corporate tax collections, statutory marginal tax rates, effective tax rates, R&D tax incentives, and intellectual property tax regimes.   The OECD has previously reported much of this data in other publications.

The data on total corporate tax revenue is missing two important factors from the OECD’s estimation of the annual global revenue loss from Base Erosion and Profit Shifting (BEPS).  First, one needs to know how much total corporate tax collections come from purely domestic companies compared to multinational enterprises.  Some countries, such as the U.S., have a good breakdown, but most countries could not provide the breakdown to the OECD for the 2015 BEPS Action 11 report.  That information is available for the largest MNEs operating in each country from the Country-by-Country Report (CbCR) data.  Second, the tax revenue data is after tax credits.  In some countries, tax credits for various policy initiatives reduce corporate tax collections by 30%.  For cross-country comparisons of corporate tax and comparisons of collections with statutory and effective tax rates, presentation of corporate tax collections both before and after tax credits would be beneficial.

The presentations of many statistics are based on the simple count of number of countries and unweighted averages. That means the U.S. and China are treated the same as Estonia and the Isle of Man.  Average corporate tax rates, weighted by GDP, foreign direct investment, or exports/imports, are higher than unweighted averages that give equal weight to large and small economies.  

The report notes why the ratio of corporate income tax to total revenues and GDP are influenced by a number of different factors.  Hopefully future reports will compare corporate income tax to a better proxy of corporate income, such as national statistics’ corporate operating surplus.

The statistics on R&D incentives are from the OECD Directorate for Science, Technology and Innovation, which have been presented for years.  The R&D tax incentives do not include the revenue lost from special low rates on “patent boxes”.  Hopefully future reports will collect and add that information.  More detail on the tax rates and bases of both R&D tax credits and “patent boxes” would be helpful.

The new report is an important first step since the forthcoming CbCR data should not be viewed in isolation to general corporate and cross-border business taxation.  The CbCR data will definitely improve policymakers’ view of multinational enterprises’ activities in their countries, such as the mix of corporate revenue from purely domestic and large multinational enterprises, and key relationships between the financial statistics. The CbCR will also include data of large non-corporate global businesses.  The CbCR data, however, will not be a panacea since the reports’ template doesn’t include intra-company royalties or interest, and BEPS will still need to be estimated to separate real economic effects of tax rate differentials from profit shifting.   

Given the amount of other work the OECD’s Tax Policy and Statistics Division small team has had to do this past year (including digital tax issues), the first report is a good start from which to continue to build more detailed analysis of international business taxation.  It was hoped that the first report would include some initial aggregated tabulations of the CbCR data.  It is likely that CbCR data from a number of countries was not yet available or incomplete or messy due to its first year of collection.  With an upcoming 2020 review of the CbCR template with possible revisions by the BEPS Inclusive Framework, early publication of aggregate data and assessment of the CbCR’s effectiveness in transfer pricing administration is important.  [On January 29, 2019 during the OECD TaxTalk, Pascal Saint-Amans reported that the OECD will try to release some aggregated CbCR data to the G20 Finance Ministers meeting in June 2019.]

Individual countries should be encouraged to release unilaterally their CbCR aggregated tabulations in the format requested by the BEPS Inclusive Framework for OECD publication. In the case of the United States, fairly similar data is available from the Form 5471 from US-headquartered multinationals and their foreign affiliates. A comparison of the Form 5471 data with the CbCR data will highlight similarities and differences.  

The OECD’s first Corporate Tax Statistics publication might be considered a report half-empty or half-full, since only the extension of corporate effective tax rate statistics to a larger number of countries is new data.  Pulling together data in one publication and database is helpful, but also highlights how much more policymakers and policy analysts need to know about corporate and international business taxation.  With the addition of future CbCR data and additional statistical measures, future publications will be even more worthwhile.  

Tom Neubig

What's wrong with this picture? Assignment of IP and IP income to low-tax rate countries

January 9, 2019 Tom Neubig
CUIP%R&D2016 at 20190109.png

Sacha Wunsch-Vincent of the World Intellectual Property Organization (WIPO) and I have a forthcoming chapter in a World Trade Organization (WTO) book which extends our analysis of tax distortions in the location of intellectual property. Not surprisingly, low tax rates have encouraged the assignment of intangible income by multinational enterprises to countries with low effective tax rates. The bad news is that tax-motivated profit shifting has distorted reduced governmental revenues and distorted national statistics. The good news is that such distortions will be reduced in the future due to collaborative governmental policies.

The OECD/G20 BEPS project addressed the disconnect between the location of taxable income and the location of value creation.  The project instituted standards to prevent harmful tax competition, updated standards for tax treaties and transfer pricing, and instituted new country-by-country reporting of MNEs for improved transfer pricing administration, among other changes.  

Information from the World Development Indicators on cross-border charges for the use of intellectual property (CUIP) has not previously been used to assess profit shifting from transfer mispricing and the strategic location of IP, which have been estimated to be the main channels of base erosion and profit shifting.   Cross-border IP receipts should be strongly related to prior R&D expenditures.

A simple analysis examines whether corporate tax rates, including tax rates for certain intangible income, affects the relationship of cross-border IP receipts and prior year R&D expenditures across countries.  The figure above shows a high ratio for several countries with low tax rates or tax regimes providing low effective taxation of IP.  Luxembourg, Netherlands and Ireland have ratios exceeding 175% while Japan, Germany and the U.S. have ratios below 25%. Profit shifting, not real economic activity, explains the vast differences.

Regression analysis of CUIP, R&D, outbound FDI and tax rate data for 29 OECD countries from 2005 to 2016 finds that a one percentage point lower tax rate on IP income increases the ratio of IP income to lagged R&D expenditures by 5-7 percent. This is consistent with other empirical findings showing greater transfer mispricing in R&D intensive sectors and the strategic location of IP in countries with low tax rates. Non-tax explanations can not fully account for the consistent pattern of higher IP receipts relative to prior year R&D expenditures recorded in countries with lower tax rates. Future research could use this type of data to determine if the OECD/G20 BEPS project and implementation of anti-avoidance rules by countries since 2014 are reducing tax-motivated distortions in the IP flows and national statistics. 

Regression results of excess cross-border CUIP receipts to tax rates

CUIP Regression 201901.png

The regression finds the general corporate tax rate to be statistically significant, but with a larger effect when the intangible tax rate is used.  The differential between the general and intangible tax rate has a larger effect than the intangible (favorable “patent box”) tax rate by itself.  The ratio of countries’ outbound foreign direct investment (FDI) to GDP is positive and statistically significant.  High relative outbound FDI is expected to be associated with greater cross-border activity, but also reflects countries with significant Special Purpose Entities (SPEs), which often facilitate tax planning.

A number of alternative specifications were tested. The last column shows when CUIP as a percent of GDP is an absolute rather than a ratio to lagged R&D expenditures, with a slightly larger tax differential effect.  Time fixed effects don’t affect the size of the coefficients.  The coefficient on the tax rate differential variable declines with country fixed effects, suggesting most of the effect occurs across countries rather than within individual countries.

Reductions in a country’s tax rate on IP income increases the amount of cross-border IP income relative to its lagged R&D expenditures.  Most likely that effect is driven by tax-motivated profit shifting across countries than increasing total returns to global IP investments.  Lower general corporate tax rates and non-harmful competition tax rates on IP income in countries with real R&D activity, such as the 2017 U.S. tax reform, should reduce the current shifting of IP and IP income out of the those countries.  

Tom Neubig
Digital taxation: Don’t forget personal income taxes

November 16, 2018 Tom Neubig
Digital tax barter v2.png

A number of countries have, or are proposing, new taxes on digital services where user participation, user data, or user generated content is significant.  These taxes are targeted at a small number of large multinational corporations whose users provide data or content in exchange for “free” digital services, such as search, email and/or data storage, and the user data is then sold for targeted online advertising.  

These tax proposals likely miss most of the untaxed income and services.  Information reporting or withholding by digital intermediaries, such as Uber and AirBnB, would improve tax compliance rates by household suppliers of these services.  Taxing the barter income and payments of digital platforms, such as Facebook and Google, would raise revenue while reducing economic distortions.  Ensuring digital services and goods are subject to countries’ value-added taxes would help level the playing field with domestic and non-digital suppliers.

The European Union and the United Kingdom, among others, have recently proposed interim digital services taxes prior to the G20/OECD BEPS Inclusive Framework countries reaching a more comprehensive international agreement on the corporate taxation of digital businesses. The proposals are excise taxes on certain cross-border revenue of certain digital businesses.  

The OECD’s 2018 interim report, Tax Challenges Arising from Digitalization, notes significant differences of opinion about the contribution of user data and content to the value creation (and taxable income) of multinational corporations.  Agreement on a “digital presence” permitting countries to tax multinational companies that have many users in a country is likely, but how much income to attribute to their contribution is quite controversial.  Some countries think user participation is a new factor integral to companies’ value creation. A second group of countries think user participation contributes to intangible assets used by companies in their value creation. While a third group of countries think user contributions are similar to business inputs purchased from independent third parties, and thus are not part of a company’s corporate profits.

The focus to date has been principally on international corporate income taxation.  However, the largest potential tax revenue from digital economic activity, similar to non-digital economic activity, is in personal income taxation and indirect taxation (value-added taxes).  The OECD BEPS Project recommended using the destination principle for determining the place of taxation of cross-border supplies and approaches for more effect VAT collection on the growing volume of imports of low value goods from online sales.  This is already resulting in increased VAT revenues.

Although politicians prefer to tax foreign companies, if they are serious about the potential revenue from untaxed income generated by user data and user content, they should focus on personal income taxation.  In the multi-sided business model of social networks, users receive “free” digital services, such as email, search and data storage, in exchange for providing user data, which is then available to the digital business to sell targeted customer advertising.  In these barter transactions, users provide valuable data without recognizing any (taxable) income and without paying any monetary consideration for the digital services.   This is shown in the above diagram.

The value of these individual barter transactions may be relatively small, say $5 per month, but in the aggregate, could be quite large.  If there are 500,000 users using a network, the annual barter income could be $30 million.  Instead of a 2% or 3% excise tax as envisioned in the UK and EU proposals, the average income and social security contribution rate for an average wage earner in OECD countries was 25% in 2017.  Taking into account employer social security contributions as well, the all-in average tax rate on labor income of an average wage earner was 36%.  The average VAT rate in OECD countries is 19%. 

Collecting tax on relatively small amounts of “imputed” income of households does not make administrative or economic sense, but a close proxy for such a tax could be collected at the business level using an average personal income tax rate.  The tax could be collected from any business, above a threshold, providing “free” digital services in exchange for user data or content, based on the value of providing such services to a country’s users.

A proxy tax on the personal income earned from providing data and user content to digital businesses, collected at the business level, has more justification than an arbitrary excise tax on certain business services as a proxy for taxing corporate income of digital companies.    

Additional revenue consistent with income and indirect tax principles is possible with information reporting and/or withholding on digital intermediary companies, and with a business proxy tax for barter payments of digital platform companies.  

Tom Neubig

Transparency of tax expenditures in 43 countries

November 14, 2018 Tom Neubig
CEP Tax exp cover.png

I had the pleasure of working with Agustin Redonda of the Swiss think-tank, Council on Economic Policies (CEP), on the institutional issues of tax expenditure reporting in the G20 and OECD countries.  The new CEP working paper, Assessing Tax Expenditure Reporting in G20 and OECD Economies, is available at this <link>.

Although there are many issues with the identification, valuation and cross-country comparisons of tax expenditures, there should be little question about the importance of countries being transparent in their reporting of these government incentives and subsidies.  We analyze 11 dimensions of tax expenditure reporting, and divide countries into three groups: non-reporting, basic reporting, and detailed comprehensive reporting.  There is significant room in all countries to improve the transparency and analysis of tax expenditures.  

Agustin has compiled a Global Tax Expenditure Database for these countries, so you will see more information soon about countries use of their tax systems in ways that could be done through direct expenditures or government lending.

Tax Expenditure Analysis Currently Gets No Respect

July 12, 2018 Tom Neubig
No Respect.png

Two recent reports discuss the benefits of increased and more in-depth analysis of tax expenditures: government spending done through lower tax rates, credits, deductions, exemptions and deferrals.  

The Swiss-based Council on Economic Policies blog, which I co-wrote, discusses the importance of tax expenditure reviews as part of the United Nations’ Sustainable Development Goals. While important for developing countries, even OECD/G20 countries fall well short of transparency and evaluation benchmarks.   See link.

The Urban Institute released a study describing the minimal analysis of tax expenditures and suggesting some options to enhance the evaluation of effectiveness of US tax expenditures.  See link.

Although some people cite conceptual and measurement issues as reasons not to undertake more analysis of tax expenditures, some key institutional best practices could provide more empirical-based analytics of the effectiveness of these government subsidy programs.

To paraphrase Rodney Dangerfield, tax expenditure analysis gets no respect.  

As an example of no respect, a bill sponsored by Ways and Means Committee ranking member Sander Levin, in the “American Jobs and Closing Tax Loopholes Act of 2010”, called for systematic study of tax expenditures.  The provision required the Chief of Staff of the Joint Committee on Taxation, in consultation with the Comptroller General, to submit to the House Ways and Means Committee and the Senate Finance Committee a report on each tax expenditure. Reports for each tax expenditure “are to be submitted first, in order from those with the least aggregate cost to the greatest aggregate cost.”   See link, page 123.

The legislation had the right idea for information and analysis of tax expenditures, but meaningful analysis of the largest tax expenditures would be like waiting for Godot.  “Such reports shall contain the following: (1) an explanation of the tax expenditure and any relevant economic, social, or other context under which it was first enacted; (2) a description of the intended purpose of the tax expenditure; (3) an analysis of the overall success of the tax expenditure in achieving such purpose, and evidence supporting such analysis; (4) an analysis of the extent to which further extending the tax expenditure, or making it permanent, would contribute to achieving such purpose; (5) a description of the direct and indirect beneficiaries of the tax expenditure, including identifying any unintended beneficiaries; (6) an analysis of whether the tax expenditure is the most cost-effective method for achieving the purpose for which it was intended, and a description of any more cost-effective methods through which such purpose could be accomplished; (7) a description of any unintended effects of the tax expenditure that are useful in understanding the tax expenditure’s overall value; (8) an analysis of how the tax expenditure could be modified to better achieve its original purpose; (9) a brief description of any interactions (actual or potential) with other tax expenditures or direct spending programs in the same or related budget function worthy of further study; and (10) a description of any unavailable information the staff of the Joint Committee on Taxation may need to complete a more thorough examination and analysis of the tax expenditure, and what must be done to make such information available.”

As countries face increasing fiscal deficits and pressing social needs, hopefully increased focus on the effectiveness of tax expenditures will get more attention and respect.  Expect more studies like these to start focusing on the importance of evaluating tax expenditures.

Tom Neubig

UofM’s Office of Tax Policy Research 30th Anniversary

June 26, 2018 Tom Neubig
OTPR 30th.png

Joel Slemrod began the University of Michigan’s Office of Tax Policy Research in 1988, and this weekend celebrated its 30th anniversary with an excellent conference.

OTPR has become one of the top academic forces in global tax policy and tax administration with its many publications, conferences, and its outstanding tax scholars that now are several professional generations old and growing.  Over ninety PhDs in tax areas have emerged from OTPR and are now at the U.S. Treasury’s Office of Tax Analysis, the Joint Committee on Taxation, the Congressional Budget Office, many other countries’ finance and tax administrations, as well as other important academic and non-government institutions.  Mary Ceccanese (30 years) and Jim Hines (20 years) have also been instrumental in OTPR’s success.  

I was fortunate to be the moderator of the conference’s first roundtable on global tax policy issues with a premier panel including Alan Auerbach, Richard Bird, Michael Devereux, Jim Poterba and Harvey Rosen.   The session covered many topics, including the future of destination-based taxation, the principle of value creation in the context of non-digital and digital tax, the “growth” vs. “redistribution” lens on tax policy issues, Musgravian “stabilization” policy, and developing countries’ issues including tax administration and political economy.  I highly recommend the 90-minute video of this roundtable, which can be viewed at this LINK.

The other roundtables and the paper presentations on the second day demonstrated the quality and breadth of OTPR’s research and policy/administration contributions. Congratulations to Joel, Mary, Jim and all of the OTPR family on an amazing first 30 years and many more in the future.  

Older Posts →

Powered by Squarespace